
We’re excited to announce MIG-aware cluster-wide GPU profiling in Zymtrace. With zero configuration, Zymtrace automatically detects MIG devices and attributes per-instance GPU utilization, memory, Tensor Core metrics, and full-stack GPU flamegraphs to each MIG partition.
What is MIG and why does it matter?
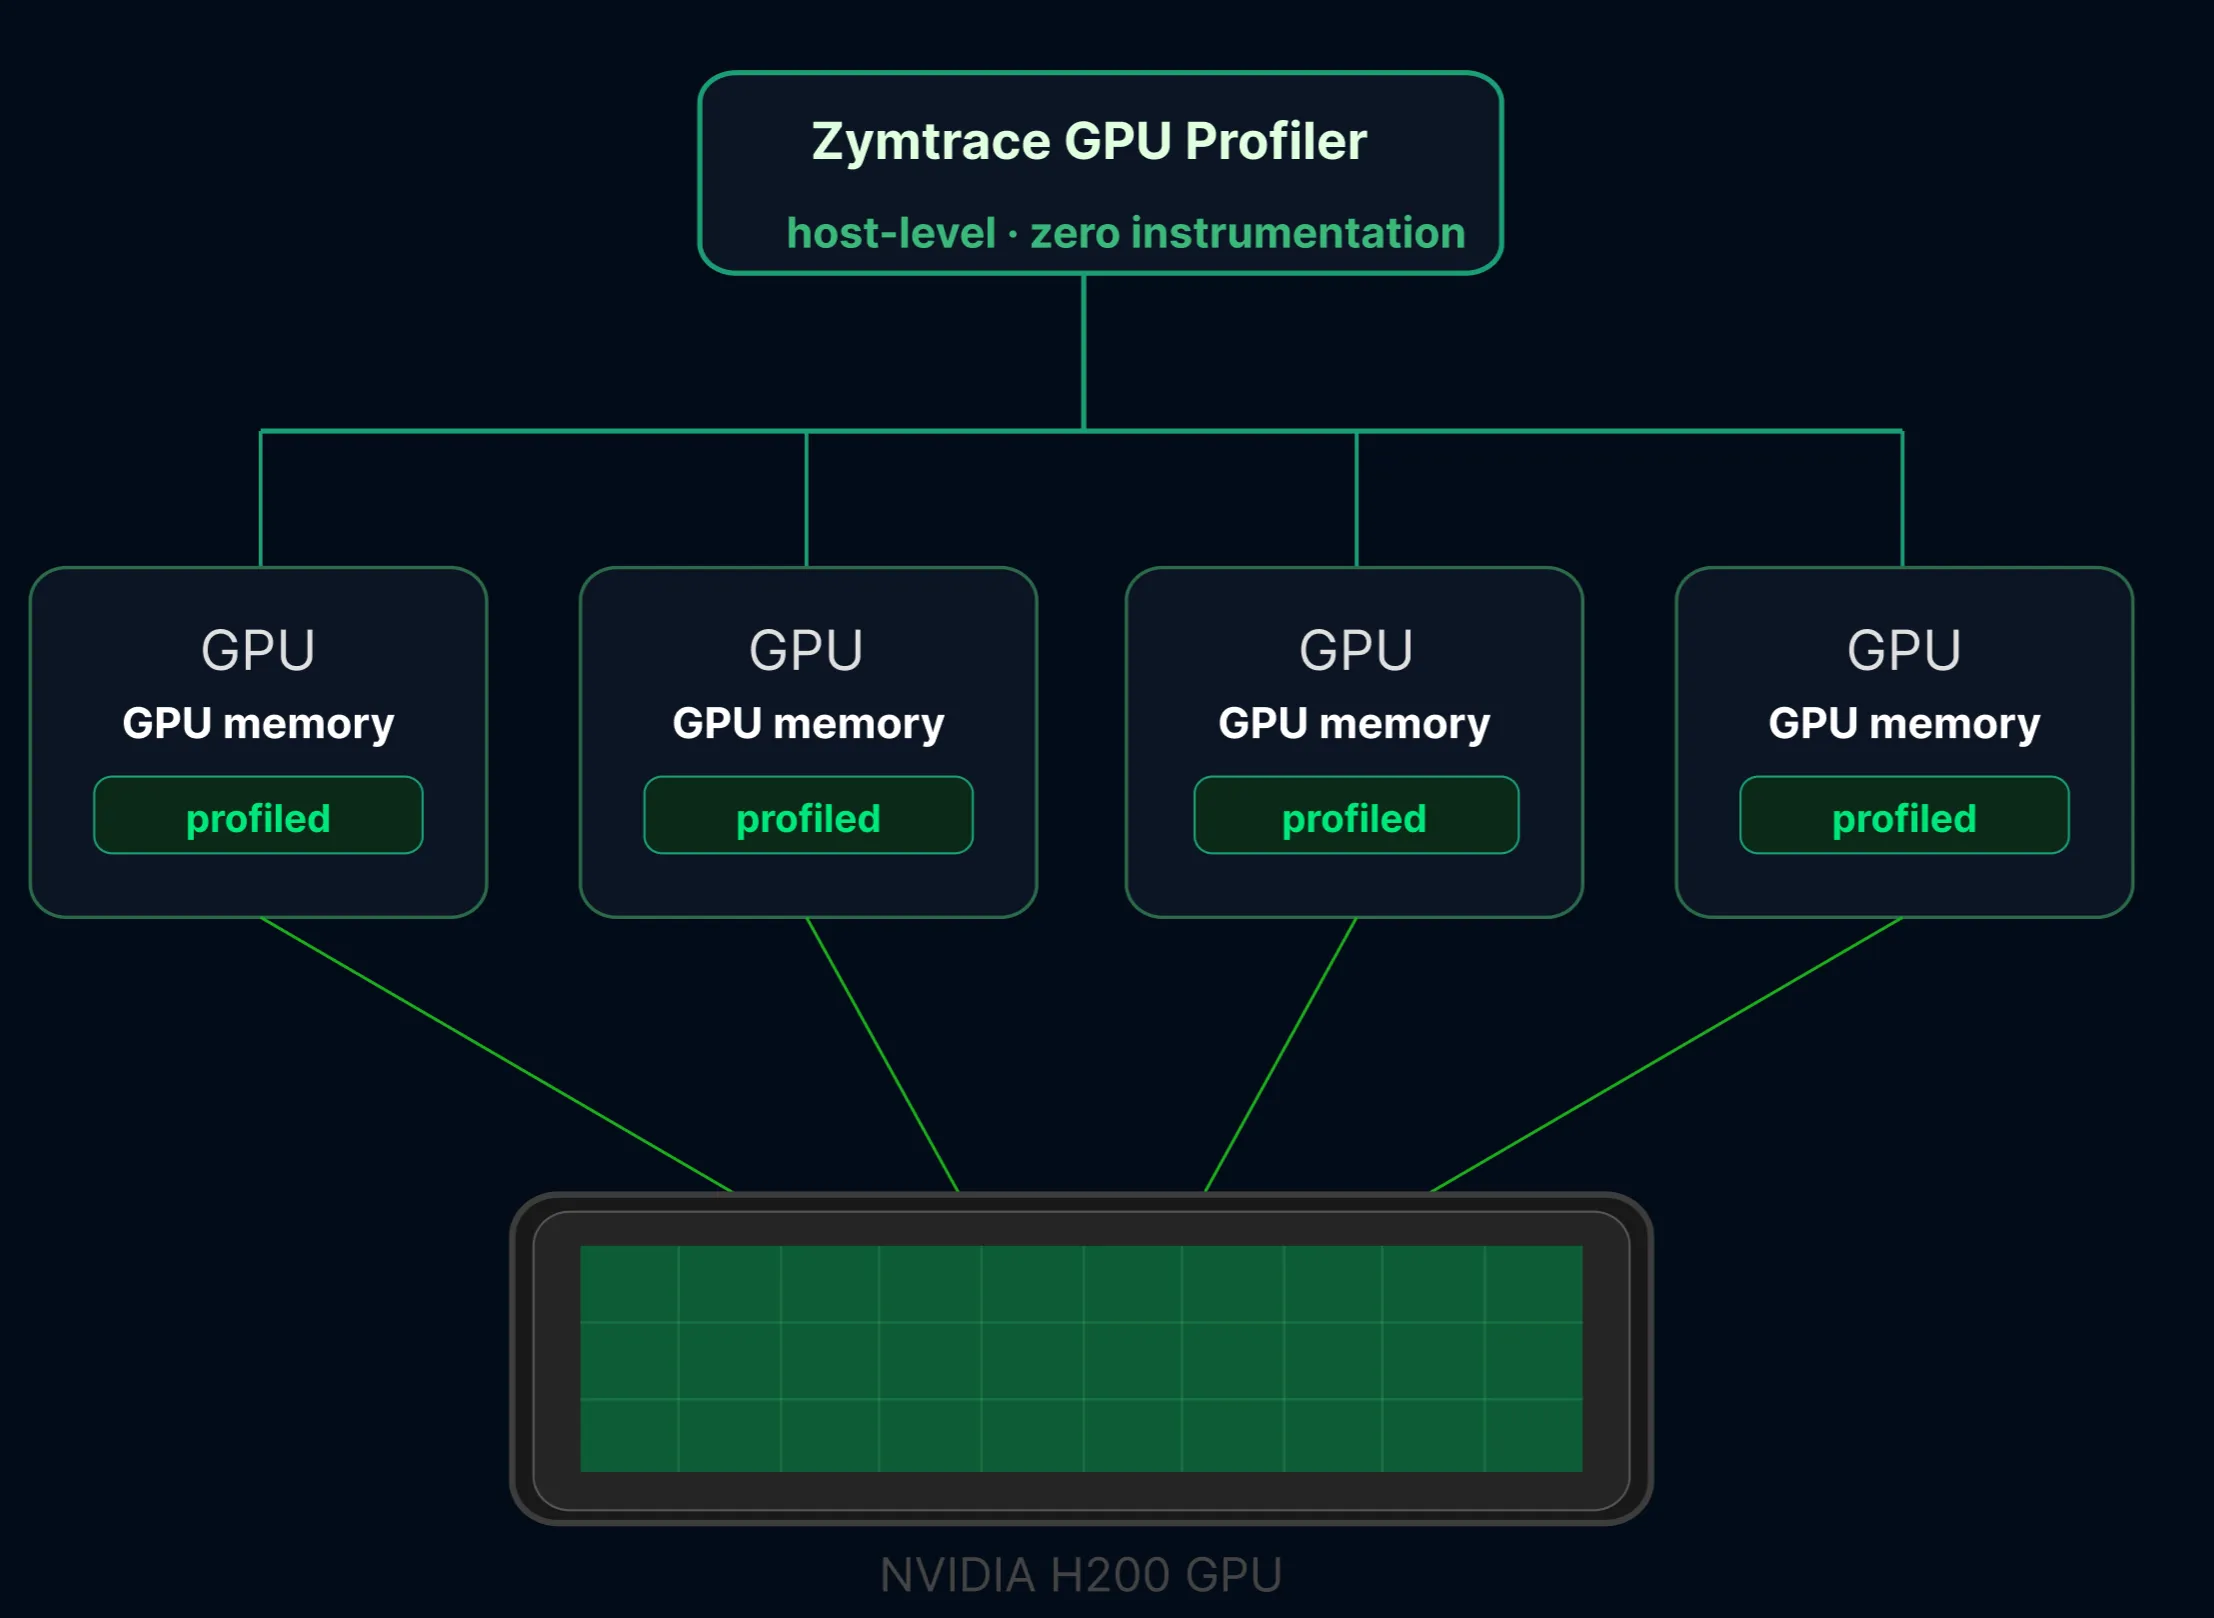
NVIDIA’s Multi-Instance GPU (MIG) technology partitions a single physical GPU into up to seven fully isolated instances, each with its own dedicated high-bandwidth memory, cache, and compute cores.1 Available on Hopper, Blackwell, and Rubin architectures, MIG is becoming the standard for multi-tenant AI inference clusters where multiple models or users share the same hardware.
The core problem MIG solves is resource contention. Without MIG, different jobs running on the same GPU compete for the same resources. A job consuming more memory bandwidth starves others, causing several to miss their latency targets.2 MIG eliminates this at the hardware level by giving each workload a guaranteed, isolated slice of the GPU.

NVIDIA MIG partitions a single GPU into isolated instances, each with dedicated compute, memory, and cache.
The profiling blind spot
MIG solves the isolation problem, but it creates a new one for performance optimization. Most profiling tools operate at the physical GPU level. They see one device, report one set of metrics, and produce one flamegraph. When multiple isolated workloads share that device through MIG, there’s no way to attribute kernel activity, memory pressure, or Tensor Core utilization to a specific instance. You lose the ability to answer the most basic question: which slice is underperforming, and why?
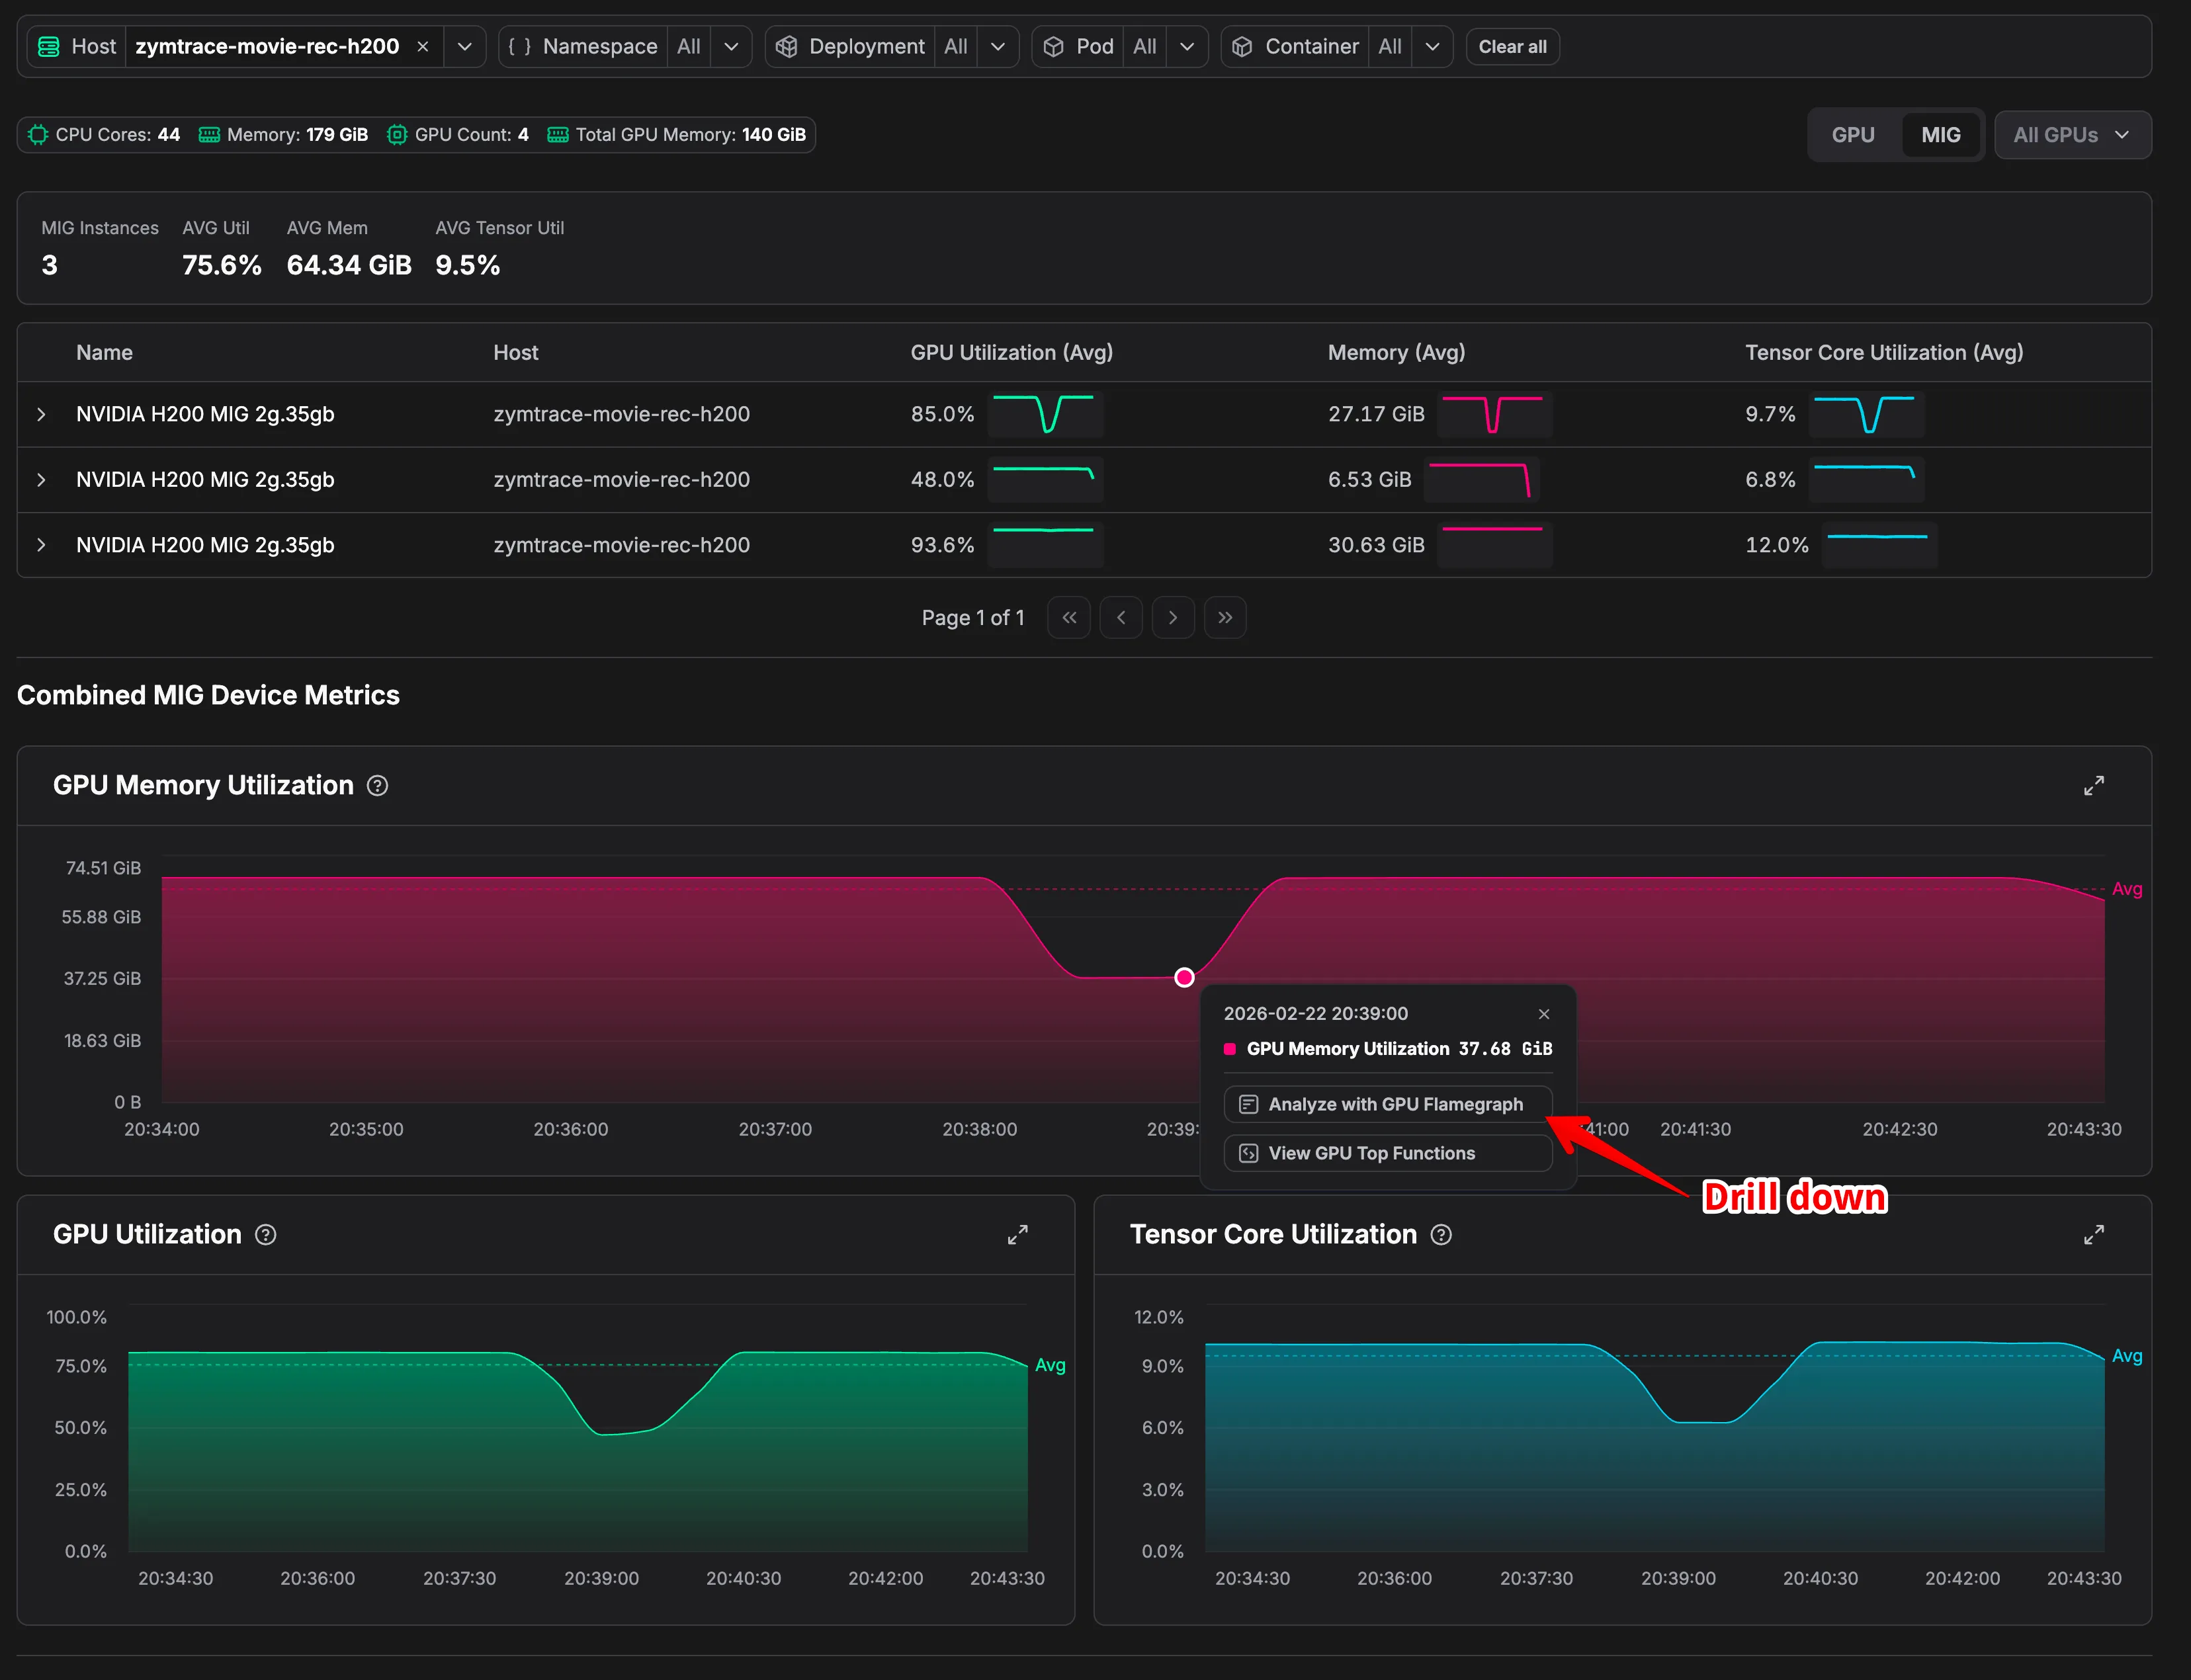
Consider three H200 2g.35gb instances on the same node running at 85%, 48%, and 93.6% GPU utilization. Averaged together, they look reasonable. They’re not. The instance at 48% is severely underutilizing its allocated resources, and only a per-instance flamegraph can surface exactly what’s causing it to leave performance on the table.

MIG drill-down: per-instance GPU utilization, memory, and Tensor Core metrics in Zymtrace.
What Zymtrace delivers
MLOps and cluster admins carve GPUs into MIG instances for isolation and efficiency. Zymtrace respects that boundary. Each slice gets its own utilization, memory, and Tensor Core metrics. From any instance, a single click surfaces a full-stack GPU flamegraph for the host, grouped by GPU and MIG slice.
The setup cost? Zero. Zymtrace auto-detects MIG topology from the host. If MIG is enabled, Zymtrace discovers every instance, maps the topology, and starts profiling each slice independently. Enable MIG, and Zymtrace sees it automatically.
Sounds interesting?
Get started today at no cost! You can host Zymtrace wherever you want. We provide both Helm charts and Docker Compose configs. If you’re familiar with either, you can have it running within 5 minutes.
Once deployed, the profiling agent automatically profiles every process running on your machines with virtually no overhead. No configuration changes, no instrumentation required. Just run it and watch profiles for all running applications appear in our UI!
For GPU workloads, we support everything built on top of CUDA, including frameworks like PyTorch and JAX. For CPU profiling, we support all major languages out of the box: Python, Java, Kotlin, Node.js, PHP, Ruby, .NET, C/C++, Rust, Go, and more.
Footnotes
-
NVIDIA, Multi-Instance GPU. MIG is supported on Hopper, Blackwell, and Rubin architectures, with up to seven isolated instances per GPU each receiving dedicated compute, memory, and cache. ↩
-
NVIDIA describes the core problem MIG addresses: without it, jobs sharing a GPU compete for memory bandwidth, causing latency degradation across all co-located workloads. MIG provides hardware-level isolation with guaranteed quality of service per instance. ↩


