GPU Topology Health: Zymtrace Adds the Missing Hardware Layer
Zymtrace now ties CPU and GPU profiles, inference metrics, GPU performance metrics, and topology health into one workflow for finding whether slow workloads are caused by code, placement, or hardware.


Israel Ogbole
GPU performance work breaks down when software and hardware are investigated in separate tools. The same symptom, a slow AI workload, can come from CPU orchestration, engine batching, a CUDA kernel, GPU saturation, NUMA placement, ECC errors, or a degraded NVLink path. Each has a different fix. GPU topology health adds the missing hardware signal to Zymtrace’s optimization layer, alongside CPU and GPU profiles, inference metrics, and GPU performance metrics, so teams can tell whether to tune code, change placement, or repair the node.
The missing hardware layer
Before this release, Zymtrace had three parts of the optimization problem covered. CPU and GPU profiles showed execution: host orchestration, CUDA kernels, stalls, and SASS-level NVIDIA GPU instructions [1]. Inference metrics showed serving behavior: latency, throughput, and batching. GPU performance metrics showed utilization, Tensor Core activity, SM efficiency [2], and memory bandwidth.
That was enough for problems rooted in code or configuration. A vLLM deployment starved by tokenization. A training workload held back by a slow DataLoader. A CUDA kernel stalled on global memory. In each case, the profile is the evidence.
The missing signal was the hardware path underneath the workload. A process can run on CPUs that are not local to its GPU and pay for every host-to-device transfer. An NVLink pair can keep its bond count while throwing CRC errors [3]. A GPU can have pending row remaps from ECC faults [4]. From the application, all of that still looks like a slow workload. The code is innocent, but the system around it is not.
Topology health supplies that missing evidence. Profiles and metrics show how the workload ran. Topology health shows what it ran on: NUMA placement [5], interconnect state, link errors, and GPU health.
What topology health adds
GPU topology health reports the following for every GPU in the cluster.
| What we check | What comes back |
|---|---|
| Interconnect matrix | The path between every pair of GPUs using nvidia-smi topo -m semantics, so NV1 through NV18 for the number of bonded NVLinks, or the PCIe fallback level PIX, PXB, PHB, NODE, or SYS |
| NVLink error counters | Flit CRC errors, data CRC errors, replay errors, and recovery errors, counted per link rather than per device |
| Link recovery events | How often a link recovered successfully, and how often recovery failed |
| NVLink bandwidth | Per-link speed with TX and RX data throughput, so you can see a bond that is up but underperforming |
| Link state and version | Whether each link is inactive, attached to an NVSwitch, or attached to a peer GPU with that peer’s UUID, plus the NVLink version |
| ECC errors | Single-bit and double-bit volatile errors broken out by location across L1, L2, device memory, the register file, and texture memory |
| Retired pages | Pages retired for single-bit errors, pages retired for double-bit errors, and retirements still pending |
| Row remapping | Correctable, uncorrectable, pending, and failed remaps |
| XID errors [6] | Critical NVIDIA driver fault events subscribed straight from the driver and tagged with gpu.xid_error_id |
| PCIe error counters | Correctable errors, NAKs sent and received, receiver errors, bad TLP, bad DLLP, non-fatal and fatal errors, unsupported requests, and LCRC errors |
| NUMA affinity | Each GPU’s CPU and memory affinity at node scope, resolved against the host’s own NUMA topology including CPU lists, per-node memory, and inter-node distances |
Hover a cell in the matrix and you get the pair’s live numbers. A degraded NV18 bond might still show 42.5 GB/s on TX and 41.3 GB/s on RX, while also reporting 4.2 Flit CRC errors per second, 1.3 replay errors per second, and link recoveries.
That changes what the team does next. If a profile shows a collective stalling and the topology is clean, look at software. If the same collective is running over a degraded path, fix the node or link before tuning code.
Suggested fixes
A severity label alone does not help the on-call engineer at 2 a.m., so degradations and failures surface with a suggested fix.
Here is one from the recommendations panel.
NUMA · Process ran on non-affine CPUs
python3 pretrain_gpt.py · GPU 2 4d93ba28

Ran on CPUs 16-19, 144-146. CPUs 144-146 are not affine with this GPU.
Pin the process to NUMA node 0 CPUs (0-127), for example with numactl --cpunodebind=0.
The output includes the parts an operator needs: process, GPU, UUID, offending CPUs, correct node, and a command they can actually run.
The same pattern applies to the interconnect. When a bond degrades or a pair drops to PCIe, Zymtrace names the affected GPU, the peers it lost, and the operational step that follows, whether that is draining the node, reseating a link, or rechecking with nvidia-smi topo -m.
How to read the data
Start with the route, then look at its health. NV18 means the pair has eighteen bonded NVLinks, not that those links are healthy. The same cell can still show NV18 while CRC, replay, recovery, or bandwidth counters point to degradation underneath it. If NVLink is lost entirely, the cell falls back to the remaining PCIe/topology path: PIX, PXB, PHB, NODE, or SYS, depending on where the GPUs sit.
Then look for the shape of the failure. One bad pair can be a single link problem. A row-and-column pattern can point to the GPU at the intersection: a port, cable, or switch path that every peer relationship depends on. A clean matrix with slow collectives points you back to the profile. A SYS route, rising link counters, or non-local NUMA placement tells you to inspect the node.
This is the same class of issue that shows up in public NCCL debugging threads: a workload presents as poor GPU affinity or unexpected communication performance, and the investigation turns into PIX/PHB/PXB paths, NUMA placement, or how the runtime sees the machine’s topology (example). In Zymtrace, the matrix sits next to link counters, placement data, and the workload profile, so the operator can separate a software bottleneck from a node or fabric problem.
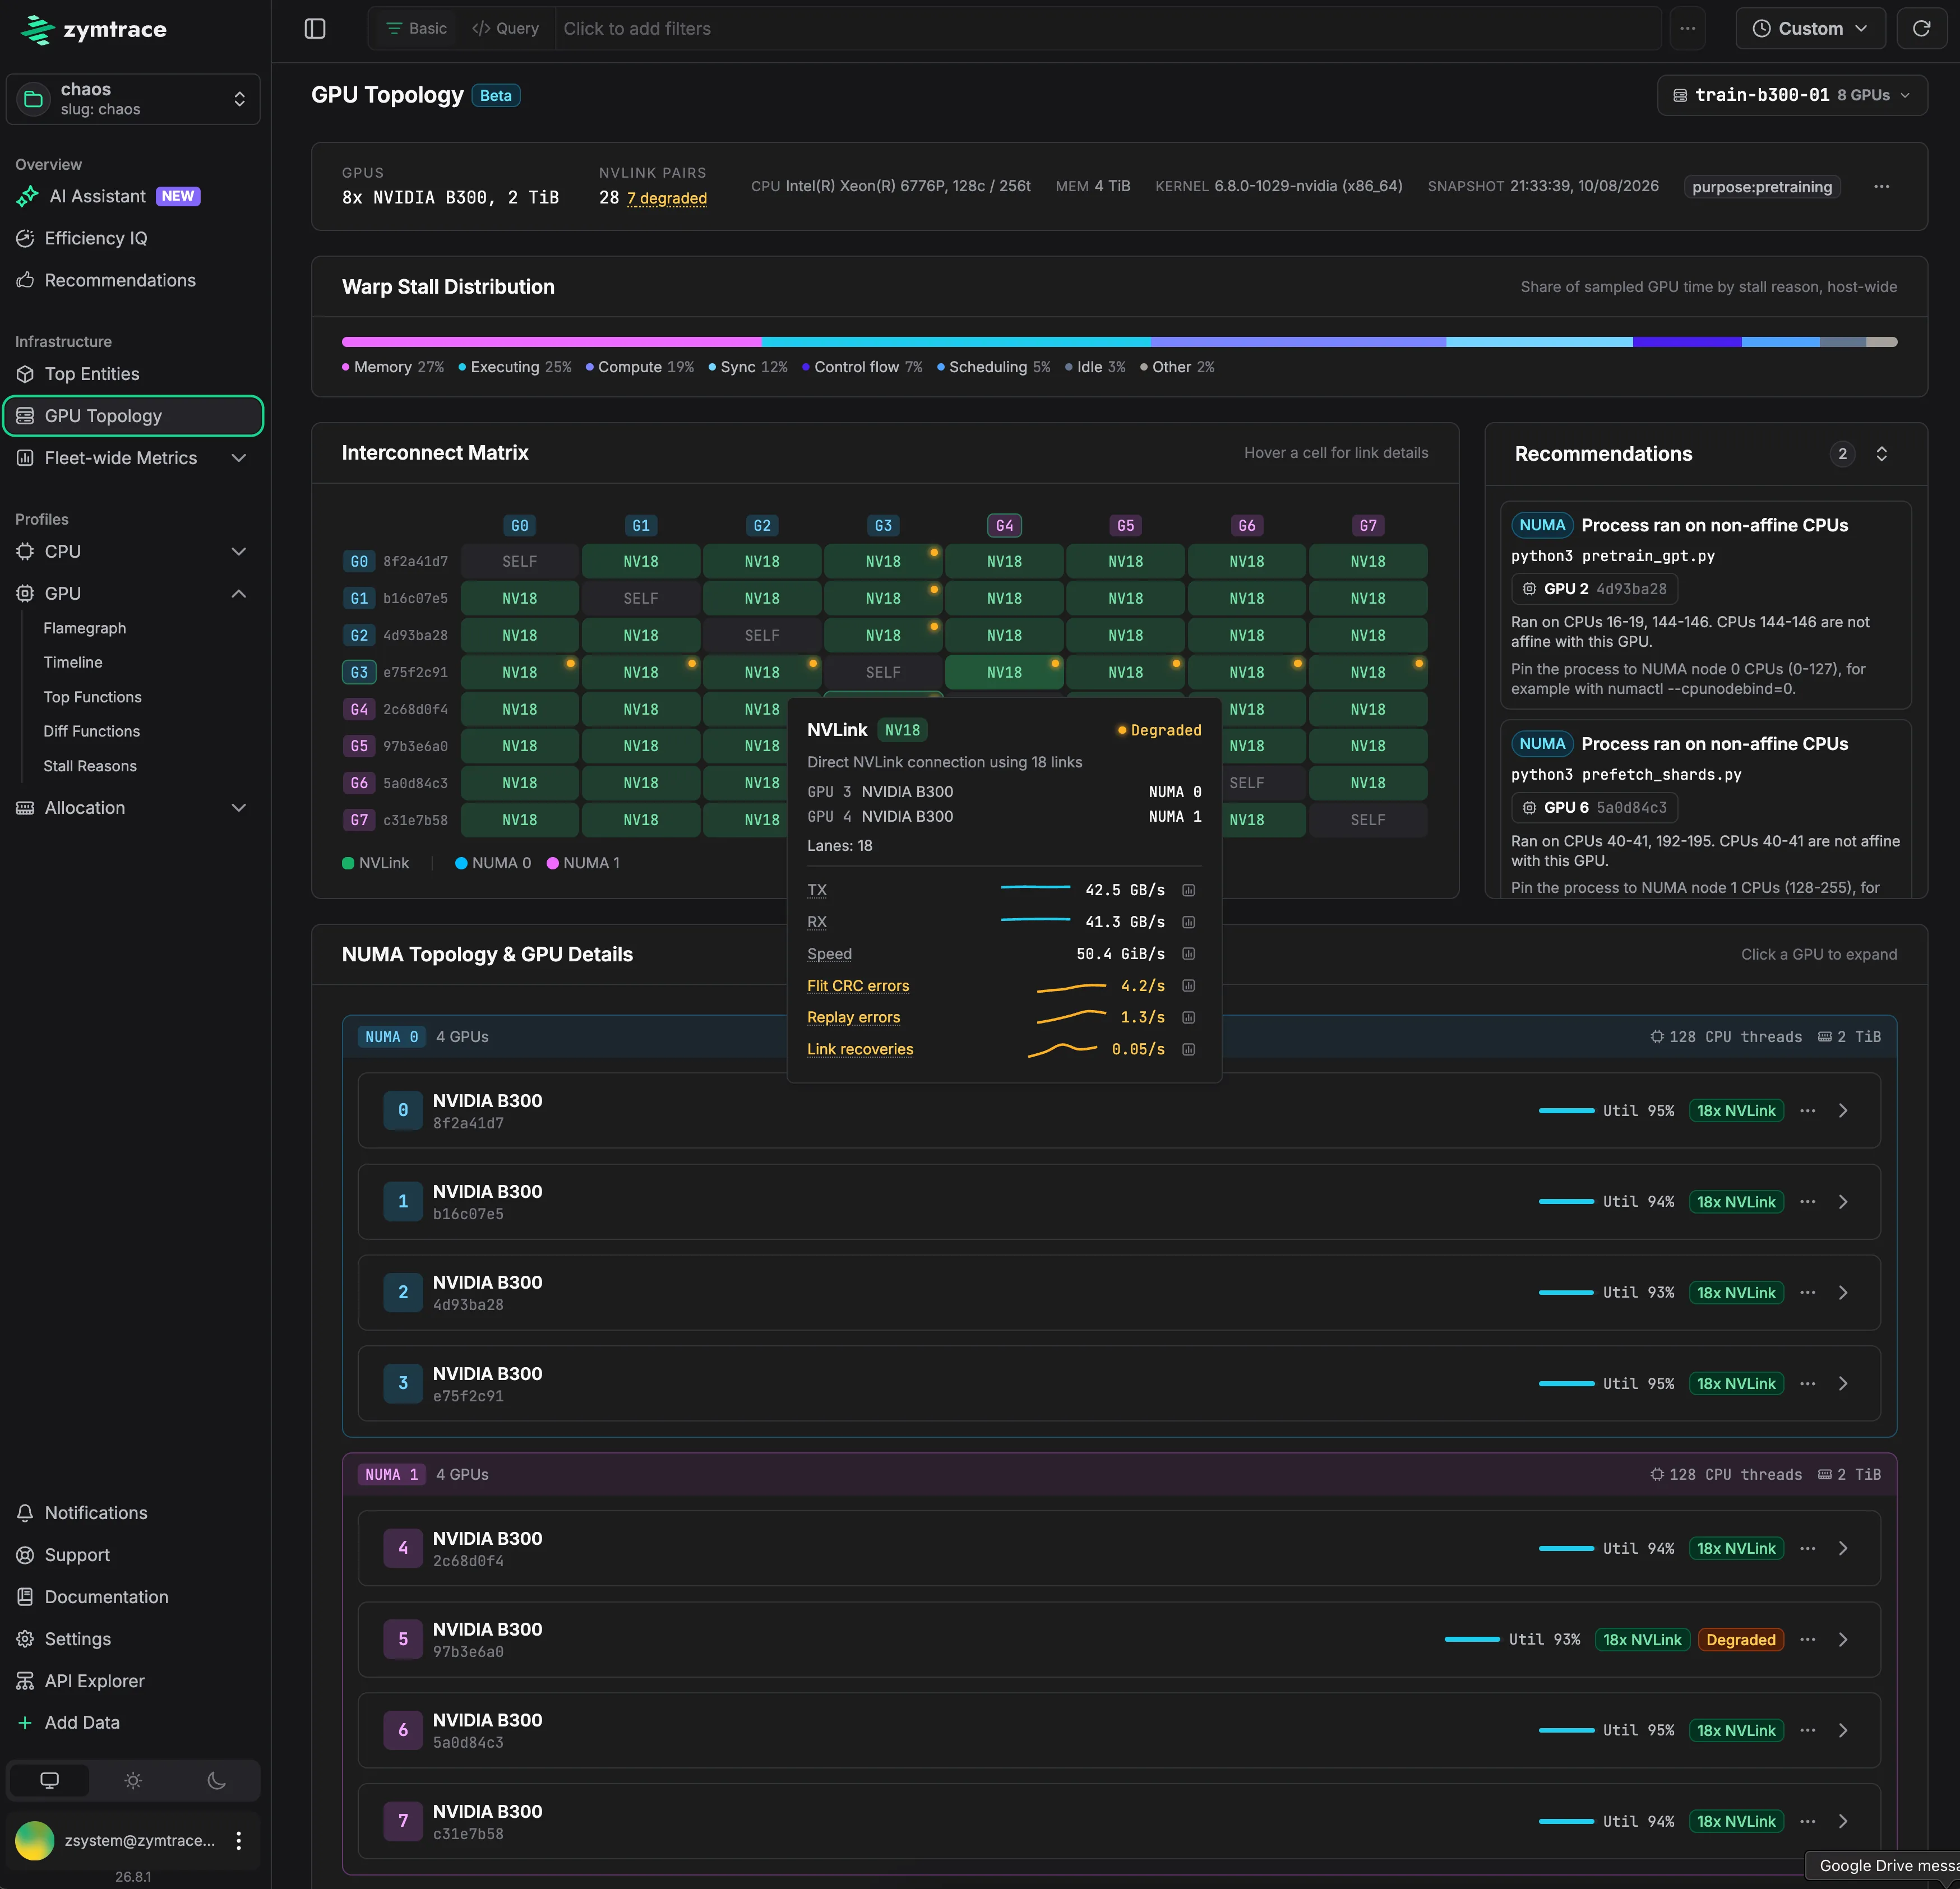
Here is the view on an 8x B300 topology, split across two NUMA nodes, with 7 of its 28 NVLink pairs degraded.
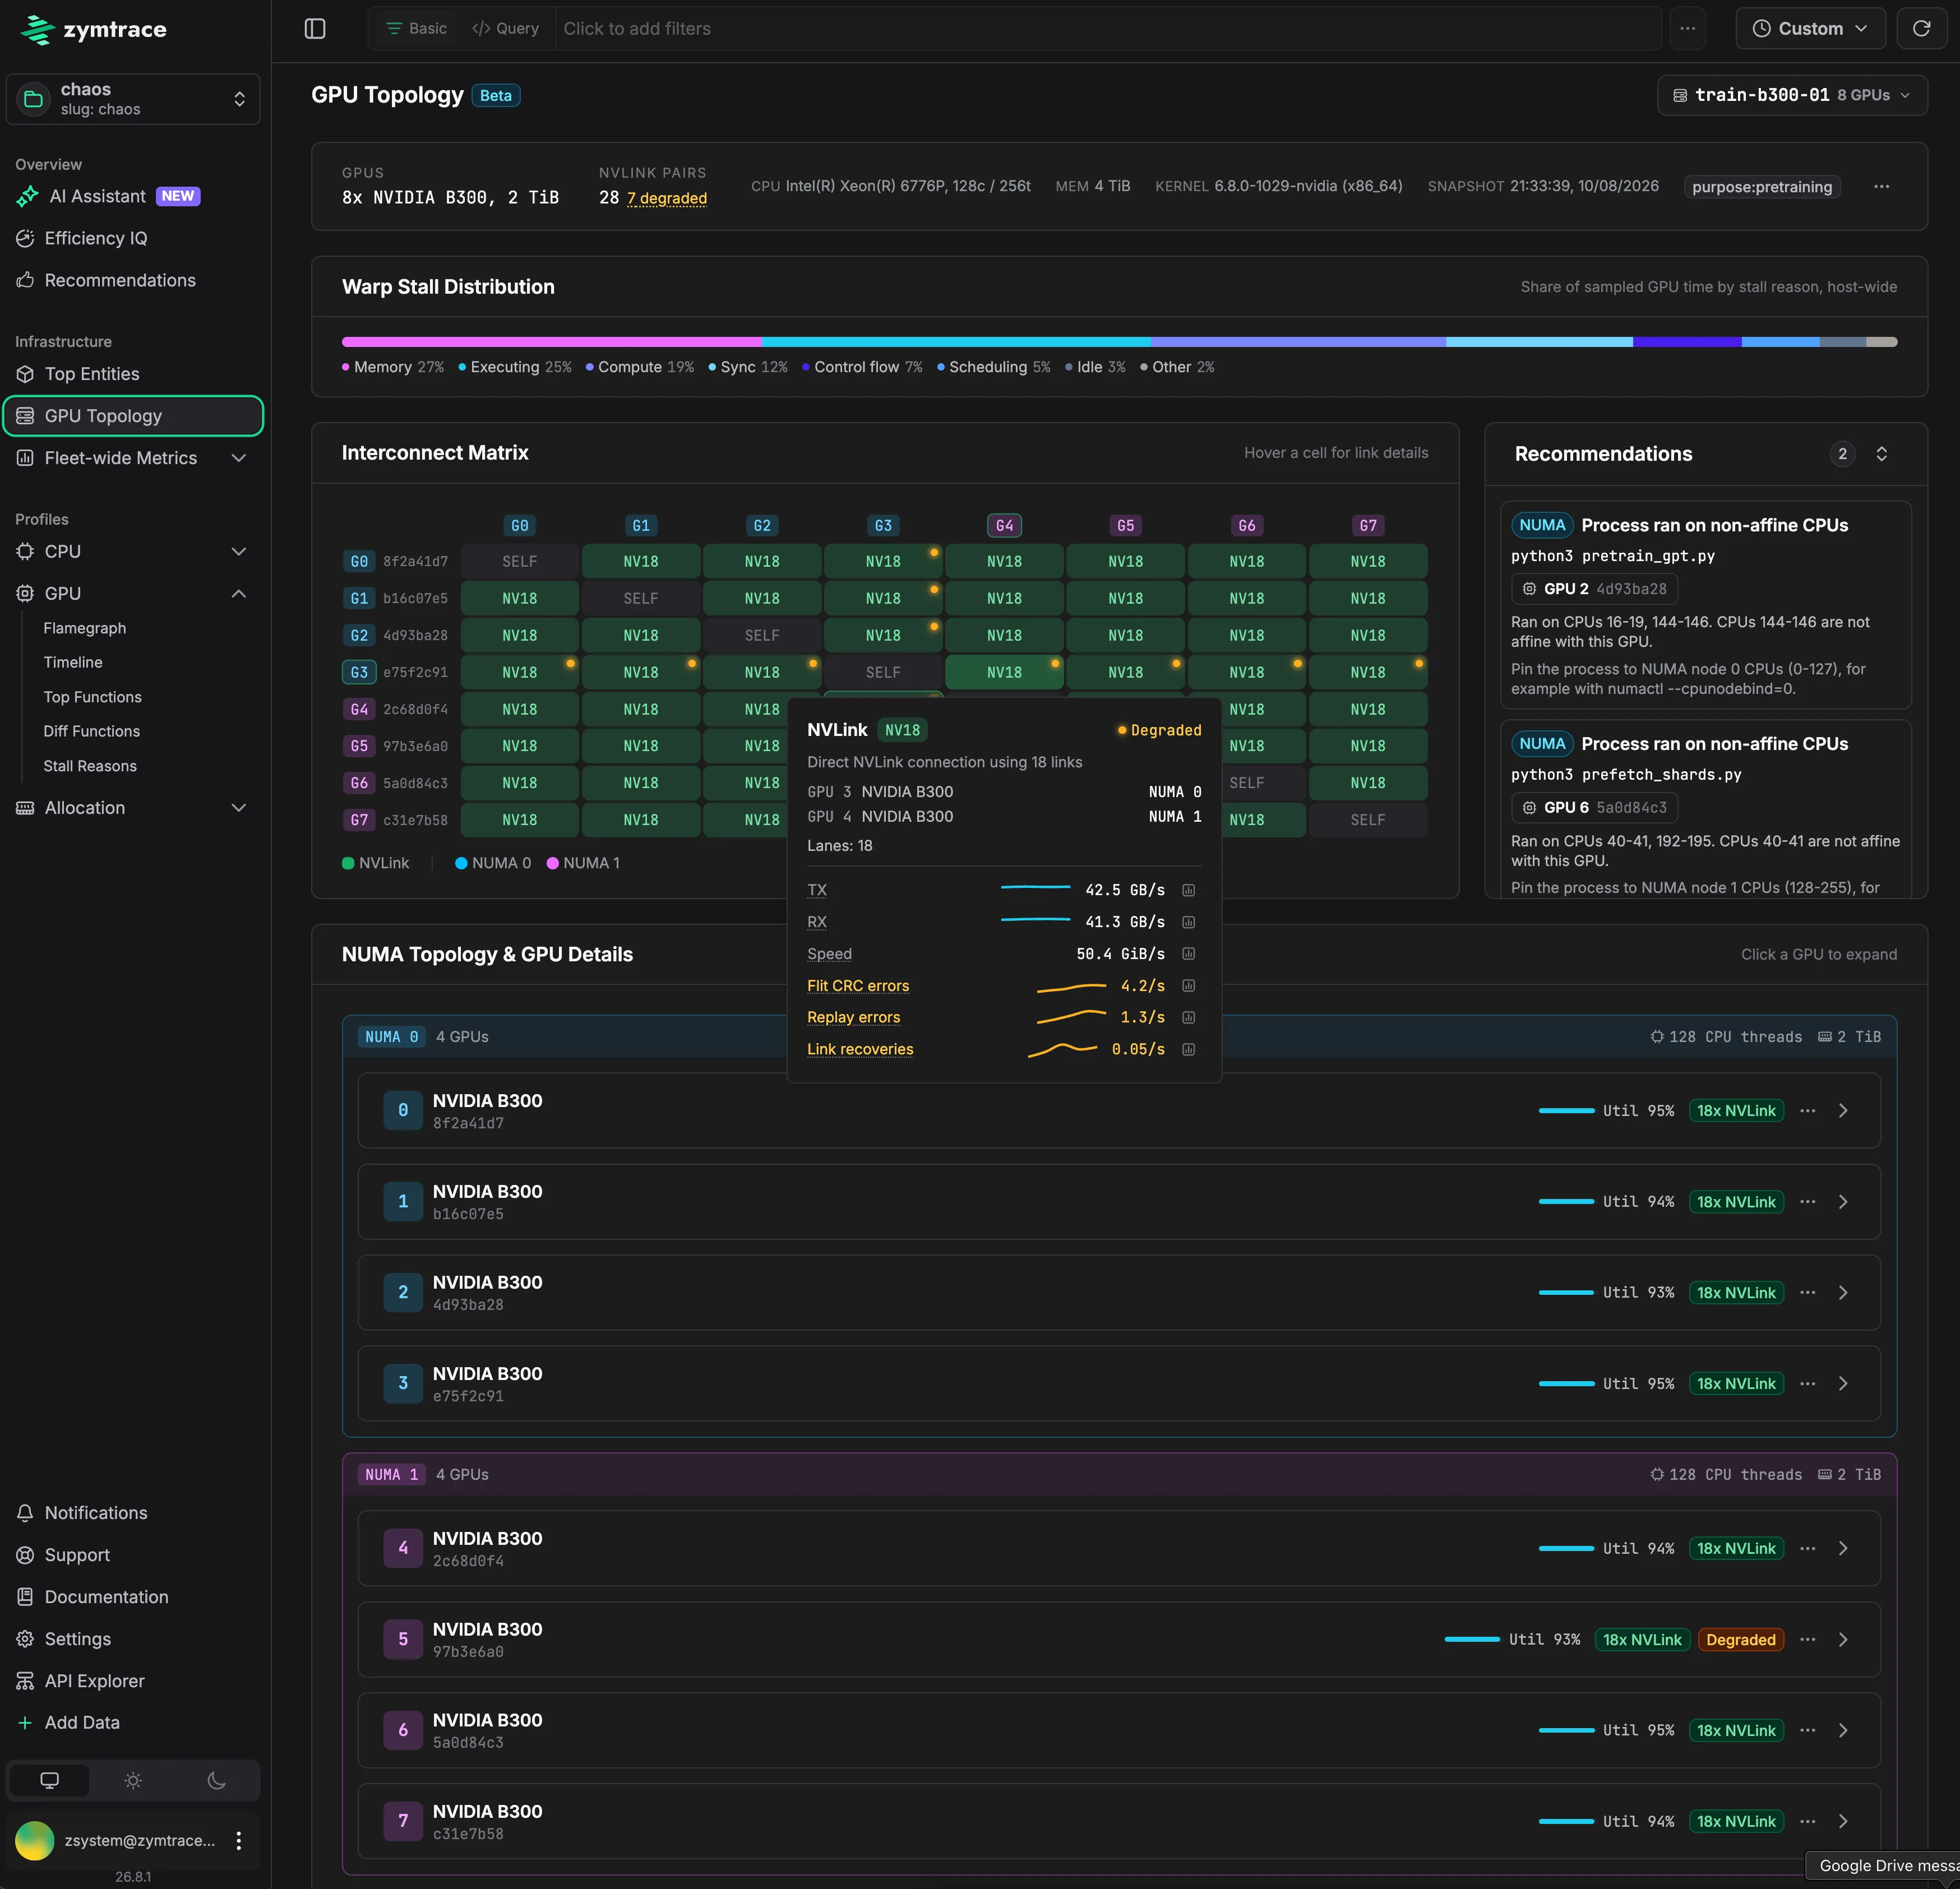
GPU topology health on an 8x B300 topology. 28 NVLink pairs with 7 degraded, every live pair still reading NV18, and the failure forming a cross through GPU 3's row and column. Hovering a cell gives that pair's throughput and error rates, and the recommendations name the process, the GPU, and the numactl command that fixes it [click to expand]
Code, placement, or hardware
Most slow-workload investigations come down to one of three fixes: change the code, change the placement, or fix the hardware. The expensive failure mode is picking the wrong one. Days of kernel tuning on a host with a sick NVLink, or a hardware ticket filed against a DataLoader problem. That is what the optimization layer is for: CPU and GPU profiles for execution, inference metrics for serving behavior, GPU performance metrics for utilization, and topology health for the hardware path beneath them all.
If the bottleneck is code, the profile should prove it. If it’s placement or fabric, the product should say so before anyone spends a week tuning Python.
GPU topology health is available in the profiler you already run: no new agent, no sidecar, and no separate exporter. Upgrade the profiler, open the topology view, and use Zymtrace to decide whether the next fix belongs in Python, Kubernetes placement, or the machine room.
Glossary
- SASS — Streaming Assembly, NVIDIA’s native GPU instruction set.
- SM — Streaming Multiprocessor, the core compute unit on an NVIDIA GPU.
- CRC — Cyclic Redundancy Check, an error-detection code used on NVLink traffic.
- ECC — Error Correcting Code, memory protection that detects and, when possible, corrects bit errors.
- NUMA — Non-Uniform Memory Access, where a CPU’s distance to a given memory bank or GPU affects access latency.
- XID — NVIDIA driver’s error-reporting mechanism for GPU faults.


