Case Study
Customer Story
How Anam Achieved 250% Faster Inference Using Zymtrace Continuous GPU Profiling

Israel Ogbole
12 mins read
•
Anam builds interactive avatars that generate photorealistic video within latency budgets measured in hundreds of milliseconds. By continuously profiling GPU workloads and integrating the resulting flamegraph into their development workflow via MCP, Anam eliminated the operational complexity and specialized GPU profiling expertise that prevent most teams from maximizing GPU efficiency.
By adopting Profile Guided AI Optimization, the team unlocked performance gains that were impossible to isolate with standard tooling (Nsight or Pytorch), achieving 250% improvement in inference latency and 90% increase in throughput for their latest model, Cara 3.
The nature of Anam’s GPU workloads
Real-time AI avatars are extraordinarily complex to build. Generating photorealistic video that responds to conversation in real time requires synchronizing lip movement, facial micro-expressions, and emotion within latency budgets measured in hundreds of milliseconds. Any delay breaks the illusion.
Because the system operates so close to its latency limits, even small performance regressions have an outsized impact on user experience. A few extra milliseconds in kernel execution or GPU idle time can immediately surface as delayed responses or degraded interaction quality.
To operate within these constraints, Anam trains their own models, writes custom CUDA kernels, and serves inference in-house. This level of control is essential for quality and reliability, but it also means that when performance degrades, inefficiencies surface quickly and propagate across the entire system.
To address this, Anam needed a lightweight, continuous GPU profiling solution that shows stacktraces from the CPU and runs safely in production. As Ben Carr explained:
We spent so much time hunting down why our GPUs were being used inefficiently—and often we couldn’t even reproduce the issue when we tried to profile it. Even when we did capture data, interpreting it required expertise only a small part of the team had, which slowed everything else down. Zymtrace solved both problems: it runs continuously, so the data is always there when issues happen, and the entire team can understand it without needing specialized GPU profiling knowledge.
The challenge: Cluster-wide GPU visibility gap
GPU performance issues are rarely about raw compute. More often, they stem from keeping the GPU fed. Small regressions in memory access patterns, NCCL collective synchronization, NVLink bandwidth saturation, or CPU dispatch jitter can leave GPUs idle, cascading into visible latency spikes and higher GPU Infra costs.
In high-performance training and inference pipelines, identifying the root cause of these issues is rarely straightforward.
When CUDA kernels underperform or Tensor Core utilization drops, engineers often reach for PyTorch Profiler or NVIDIA Nsight. Not because they’re ideal, but because they’re familiar. In practice, these tools introduce more friction than clarity. They operate at the level of individual processes or isolated GPU nodes, making frictionless, cluster-wide GPU visibility nearly impossible. For Anam, this fragmented view meant stitching together multiple tools, managing complex instrumentation, and manually correlating traces across nodes. It wasn’t sustainable. Read more on why Anam chose Zymtrace →
When Anam began evaluating Zymtrace, they expected the same integration friction they’d experienced with other profiling tools. That’s not what happened:
I was expecting the usual integration headaches like recompiling code, managing sidecars, or fighting with debug symbols. But Zymtrace was drop-in. We deployed it to the cluster and it just started streaming rich data without us touching a single line of application code.
— Bartlomiej Nogas, MLOps Engineer, Anam.
The solution: continuous GPU profiling without the “observability tax”
Anam needed a unified GPU cluster-wide solution that delivers fast performance without the operational overhead of traditional GPU profiling and monitoring solutions. They wanted to eliminate fragmented workflows, instrumentation, and manual trace parsing. They chose Zymtrace.
Zymtrace provides the cluster-wide visibility Anam lacked by building complete execution traces that span from high-level PyTorch operators and user-space libraries, through native code and CUDA kernels, down to the Linux kernel.
At the GPU level, Zymtrace goes further by capturing GPU instruction mnemonics, stall reasons, and instruction pointers, and correlating them back to the exact CPU call path that launched the CUDA kernel. This end-to-end correlation makes it possible to identify microarchitectural inefficiencies in AI workloads - such as memory dependency stalls, launch inefficiencies, or synchronization bottlenecks that are invisible in existing tools.
The results: 250% faster inference and 90% higher throughput
💡 Note: The following win stories are shared verbatim by Anam. All references to “we” and “our” reflect their perspective.
Win story 1: Removing the Python bottleneck in Cara-3 inference
Anam’s Cara-3 model, the latest iteration of our real-time avatar engine, was hitting higher-than-expected latency and inconsistent performance in real-time inference. Even on the latest NVIDIA GPUs, the workload didn’t look “GPU-bound.” The GPU would run a burst of kernels, then sit idle, then run again. Standard dashboards showed low utilization, but they didn’t explain what was causing the gaps.
What we found
With Zymtrace MCP flamegraphs, an AI Coding Agent quickly traced the stalls back to Python runtime overhead, specifically Global Interpreter Lock (GIL) contention. Full-stack traces showed a Python denoising loop repeatedly bouncing back into the interpreter on every step, which throttled CPU dispatch and left the GPU waiting.
What we changed
The agent moved the hot path out of Python by compiling the denoising core (interpolation, CFG logic, conditioning updates) into a TorchScript graph using @torch.jit.script. At the same time, we enabled CUDA Graph capture via Torch Inductor so the GPU could execute the work as a single, continuous fused stream instead of a stop-and-go sequence of small launches.
Impact
Latency dropped by 2.5× and throughput increased by 90% on the same hardware — turning Cara-3 inference from “bursty and unpredictable” into smooth, consistent real-time performance.
Win story 2: GPU profiling in Devspace without the usual pain
We use Devspace to run Kubernetes-native development environments for researchers and engineers. It’s great for iteration, but performance debugging used to be a mess: people would write custom Python scripts to capture flamegraphs, add PyTorch profiling hooks, and rebuild workflows just to answer basic questions like “what’s slow?” or “why is the GPU idle?”
What we changed
We integrated Zymtrace directly into our Devspace workflow, so engineers get real-time CPU + GPU flamegraphs inside their existing dev environment — no extra setup, no code changes, and no profiler boilerplate. Developers can immediately see where time is going across Python, CPU dispatch, the CUDA runtime, and GPU execution.
Impact
Profiling went from a specialized, time-consuming task to something engineers can do in minutes, on demand. That means faster root-cause analysis, fewer performance regressions slipping through, and less time spent maintaining one-off profiling scripts.
The MCP integration proved especially transformative for the team’s workflow:
Integrating Zymtrace via MCP was the turning point. Instead of manually combing through large flamegraphs, we could simply ask the system what was wrong and see exactly what was stalling and why. That clarity made optimization much easier for the whole team. This is exactly the kind of issue that usually disappears the moment you try to profile it. Having the data already there and instantly accessible via MCP changed the outcome completely.
Nogas reflected.
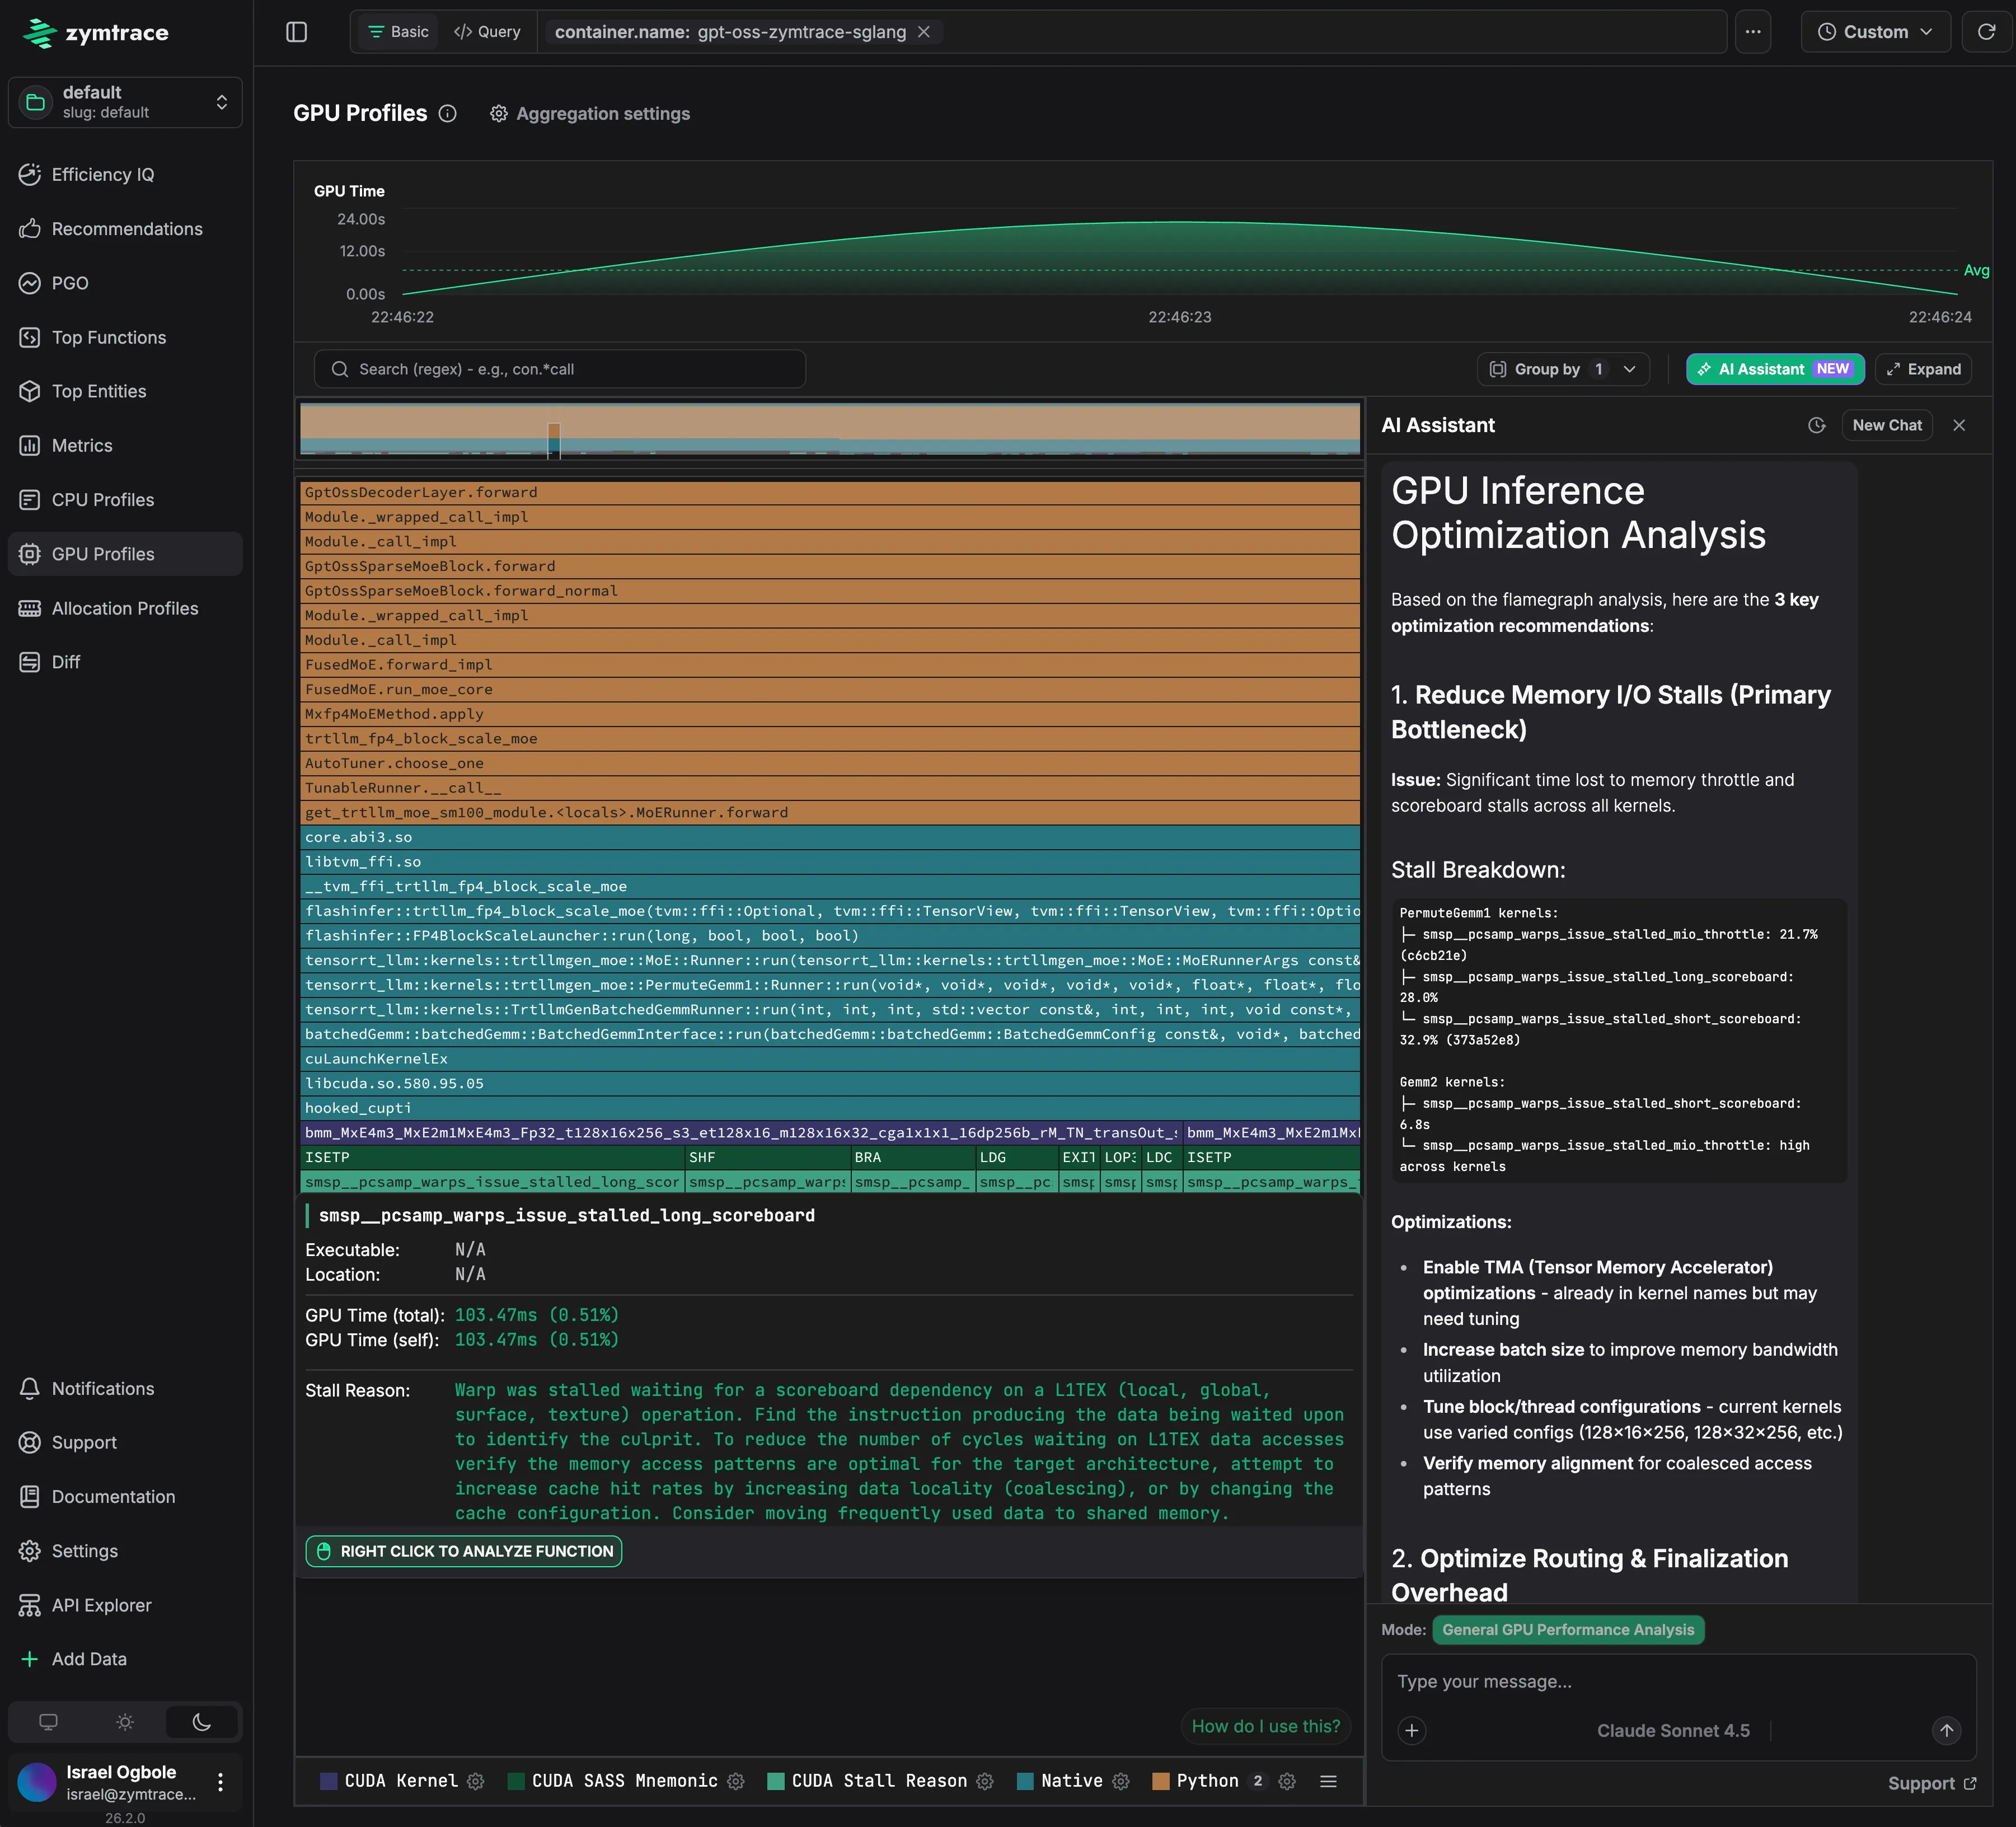
Zymtrace flamegraph showing GPU execution flow of SGLang, running gpt-oss model. (not Anam's workload.)

Why Anam chose Zymtrace
Traditional GPU profiling tools weren’t built for Anam’s requirements. Here’s how they fall short—and why Zymtrace was the answer:
- PyTorch Profiler is runtime-bound: It is strictly coupled to the Python runtime. In modern inference pipelines where execution frequently jumps between Python, Rust (common in frameworks like SGLang), and C++, PyTorch Profiler loses context the moment it crosses a language boundary.
- Nsight Systems is limited to snapshots: It is designed for short capture windows, typically under five minutes. If a regression is intermittent or emerges only after hours of runtime, Nsight Systems will likely miss it. Furthermore, the massive trace files it produces are cumbersome to parse and correlate across multiple nodes.
- Nsight Compute incurs massive overhead: While it offers deep kernel inspection, it does so by serializing execution, often slowing workloads down by orders of magnitude. This “observer effect” alters timing so drastically that it often masks the very race conditions or jitter you are trying to debug.
- Operational tax: Both Nsight tools require SSH access to individual hosts and operate on a per-process basis, forcing engineers to manually jump between machines to piece together what’s happening across a cluster. They capture snapshots of what happened on one specific device during one specific minute, but when you’re debugging distributed training or inference pipelines with dozens of GPUs and intermittent regressions, that narrow view is almost useless.
Zymtrace addressed each of these gaps directly:
1. Always-on, whole-system visibility
Zymtrace is designed from the ground up to run continuously in production. It captures the complete execution path: CPU code → CUDA kernel launches → disassembled GPU instruction execution and stall reasons.
Continuous GPU profiling is essential for inference-heavy pipelines because system entropy is driven by user requests. This is especially critical in disaggregated deployments that split prefill and decode phases, where performance can vary unpredictably.
By correlating high-level code (Python, Rust, C, etc.) directly to low-level GPU instruction mnemonics and specific stall reasons, Zymtrace reveals exactly why a CUDA kernel is underperforming. It shows whether the bottleneck is causing inefficient GPU utilization or resulting in suboptimal token economics. This leaves no blind spots.
When performance degrades, the data is already there. There is no need for instrumentation, reruns, or guessing.
Beyond the rich data, deployment is frictionless and secure:
- No code changes: No recompilation or debug symbols are required. Zymtrace uses eBPF to unwind stack traces non-intrusively, without interfering with the runtime.
- Automatic Symbolization: Native frames are symbolized after collection to reconstruct full stack traces across user-space libraries, native code, and CUDA kernels. No debug symbols are required on the host.
- 100% On-Premise & Air-Gapped: Everything runs locally. No training or inference data ever leaves Anam’s environment, making it safe for high-security workflows.
2. Profile-guided GPU optimization
Anam integrated Zymtrace via MCP (Model Context Protocol), streaming CPU and GPU profiles directly into their engineers’ existing environments.
This shifted the workflow from manually combing through GPU and CPU flamegraphs to simply asking questions in natural language:
- “What caused latency spikes in the video pipeline over the last 6 hours?”
- “Which CUDA kernels are stalling under realistic input distributions?”
- “Is the bottleneck CPU-side or GPU-side?”
The detailed execution data in flamegraphs acts as high-fidelity context for LLMs. The system immediately surfaces relevant kernels, stall reasons, and launch paths. This allows engineers to skip the interpretation phase and focus entirely on the fix.
3. Inference and GPU monitoring that explain why, not just whats

Monitor GPUs, Neuron and Inference Engines in Zymtrace
Beyond profiling, Zymtrace automatically collects host, GPU, and inference-engine metrics from the same system being analyzed.
Host metrics are captured via eBPF. This allows Zymtrace to observe CPU scheduling, contention, memory pressure, per-process network, and IO behavior with minimal overhead and without polling /proc. It effectively detects when GPUs are underutilized because they are starved while waiting on the CPU.
In parallel, Zymtrace collects GPU and inference-engine metrics, including utilization, latency, and throughput signals. Crucially, it allows teams to slice and dice these metrics by Kubernetes entities like deployments, namespaces, and containers.
Instead of treating these inputs as isolated time-series charts, Zymtrace automatically correlates them with the underlying execution profiles.
This correlation allows engineers to start from an anomalous metric, such as a spike in inference latency or a drop in GPU utilization, and immediately drill down to the exact CPU code paths, CUDA kernel launches, or memory transfers executing at that moment. Bottlenecks caused by CPU dispatch jitter, synchronization delays, or data movement become immediately visible.
Most teams attempt to approximate this by exporting DCGM metrics into Grafana. The result is usually a non-interactive dashboard that shows something is wrong, such as low Tensor Core utilization, but offers no insight into why. Zymtrace unifies metrics and profiling into a single system to connect high-level symptoms directly to low-level root causes - in the stacktraces.
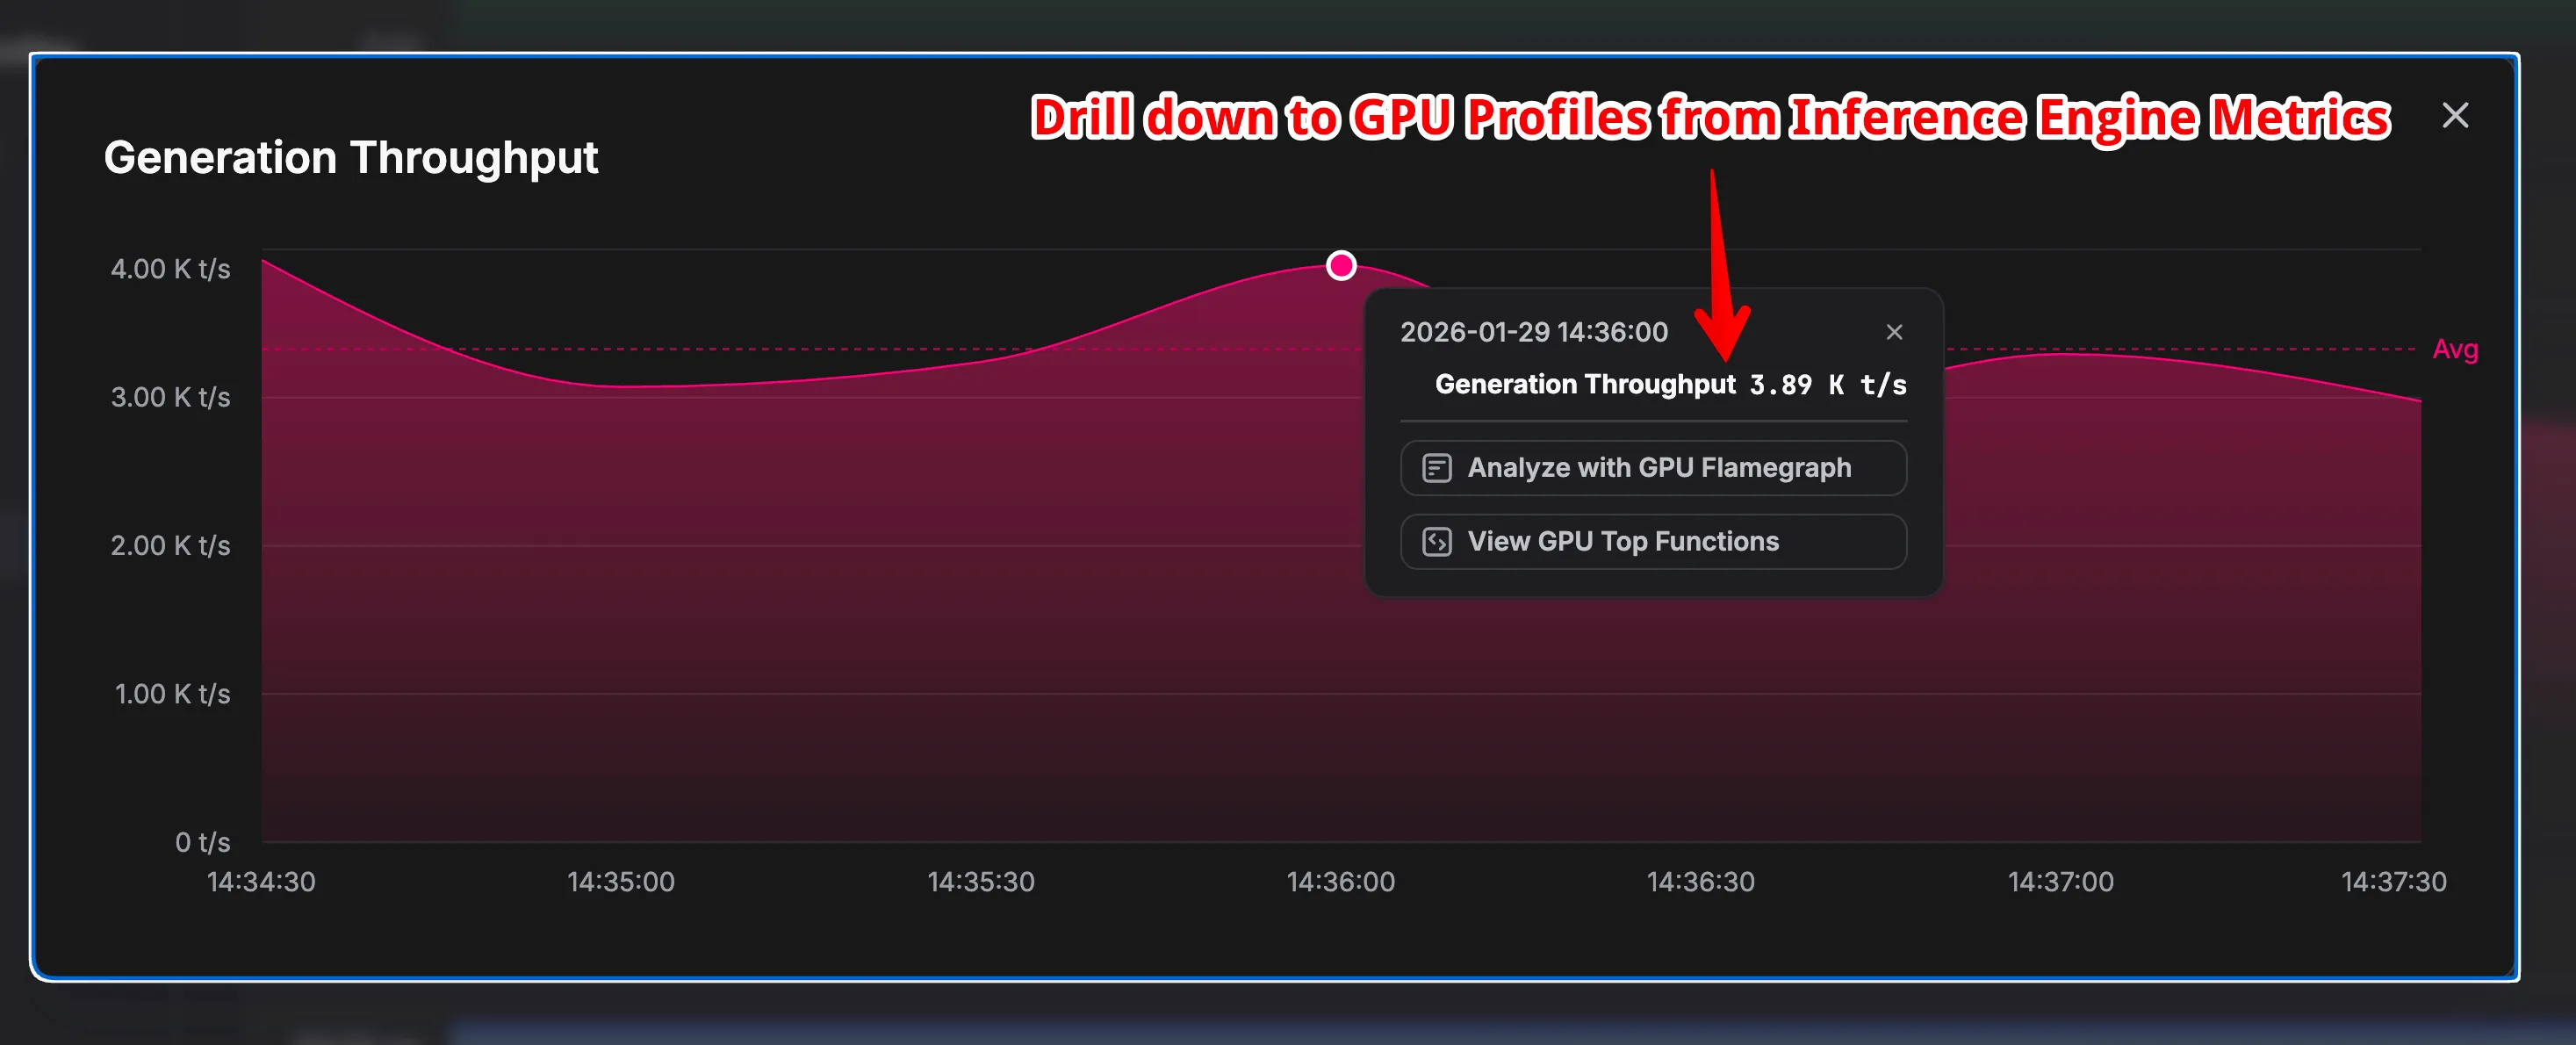
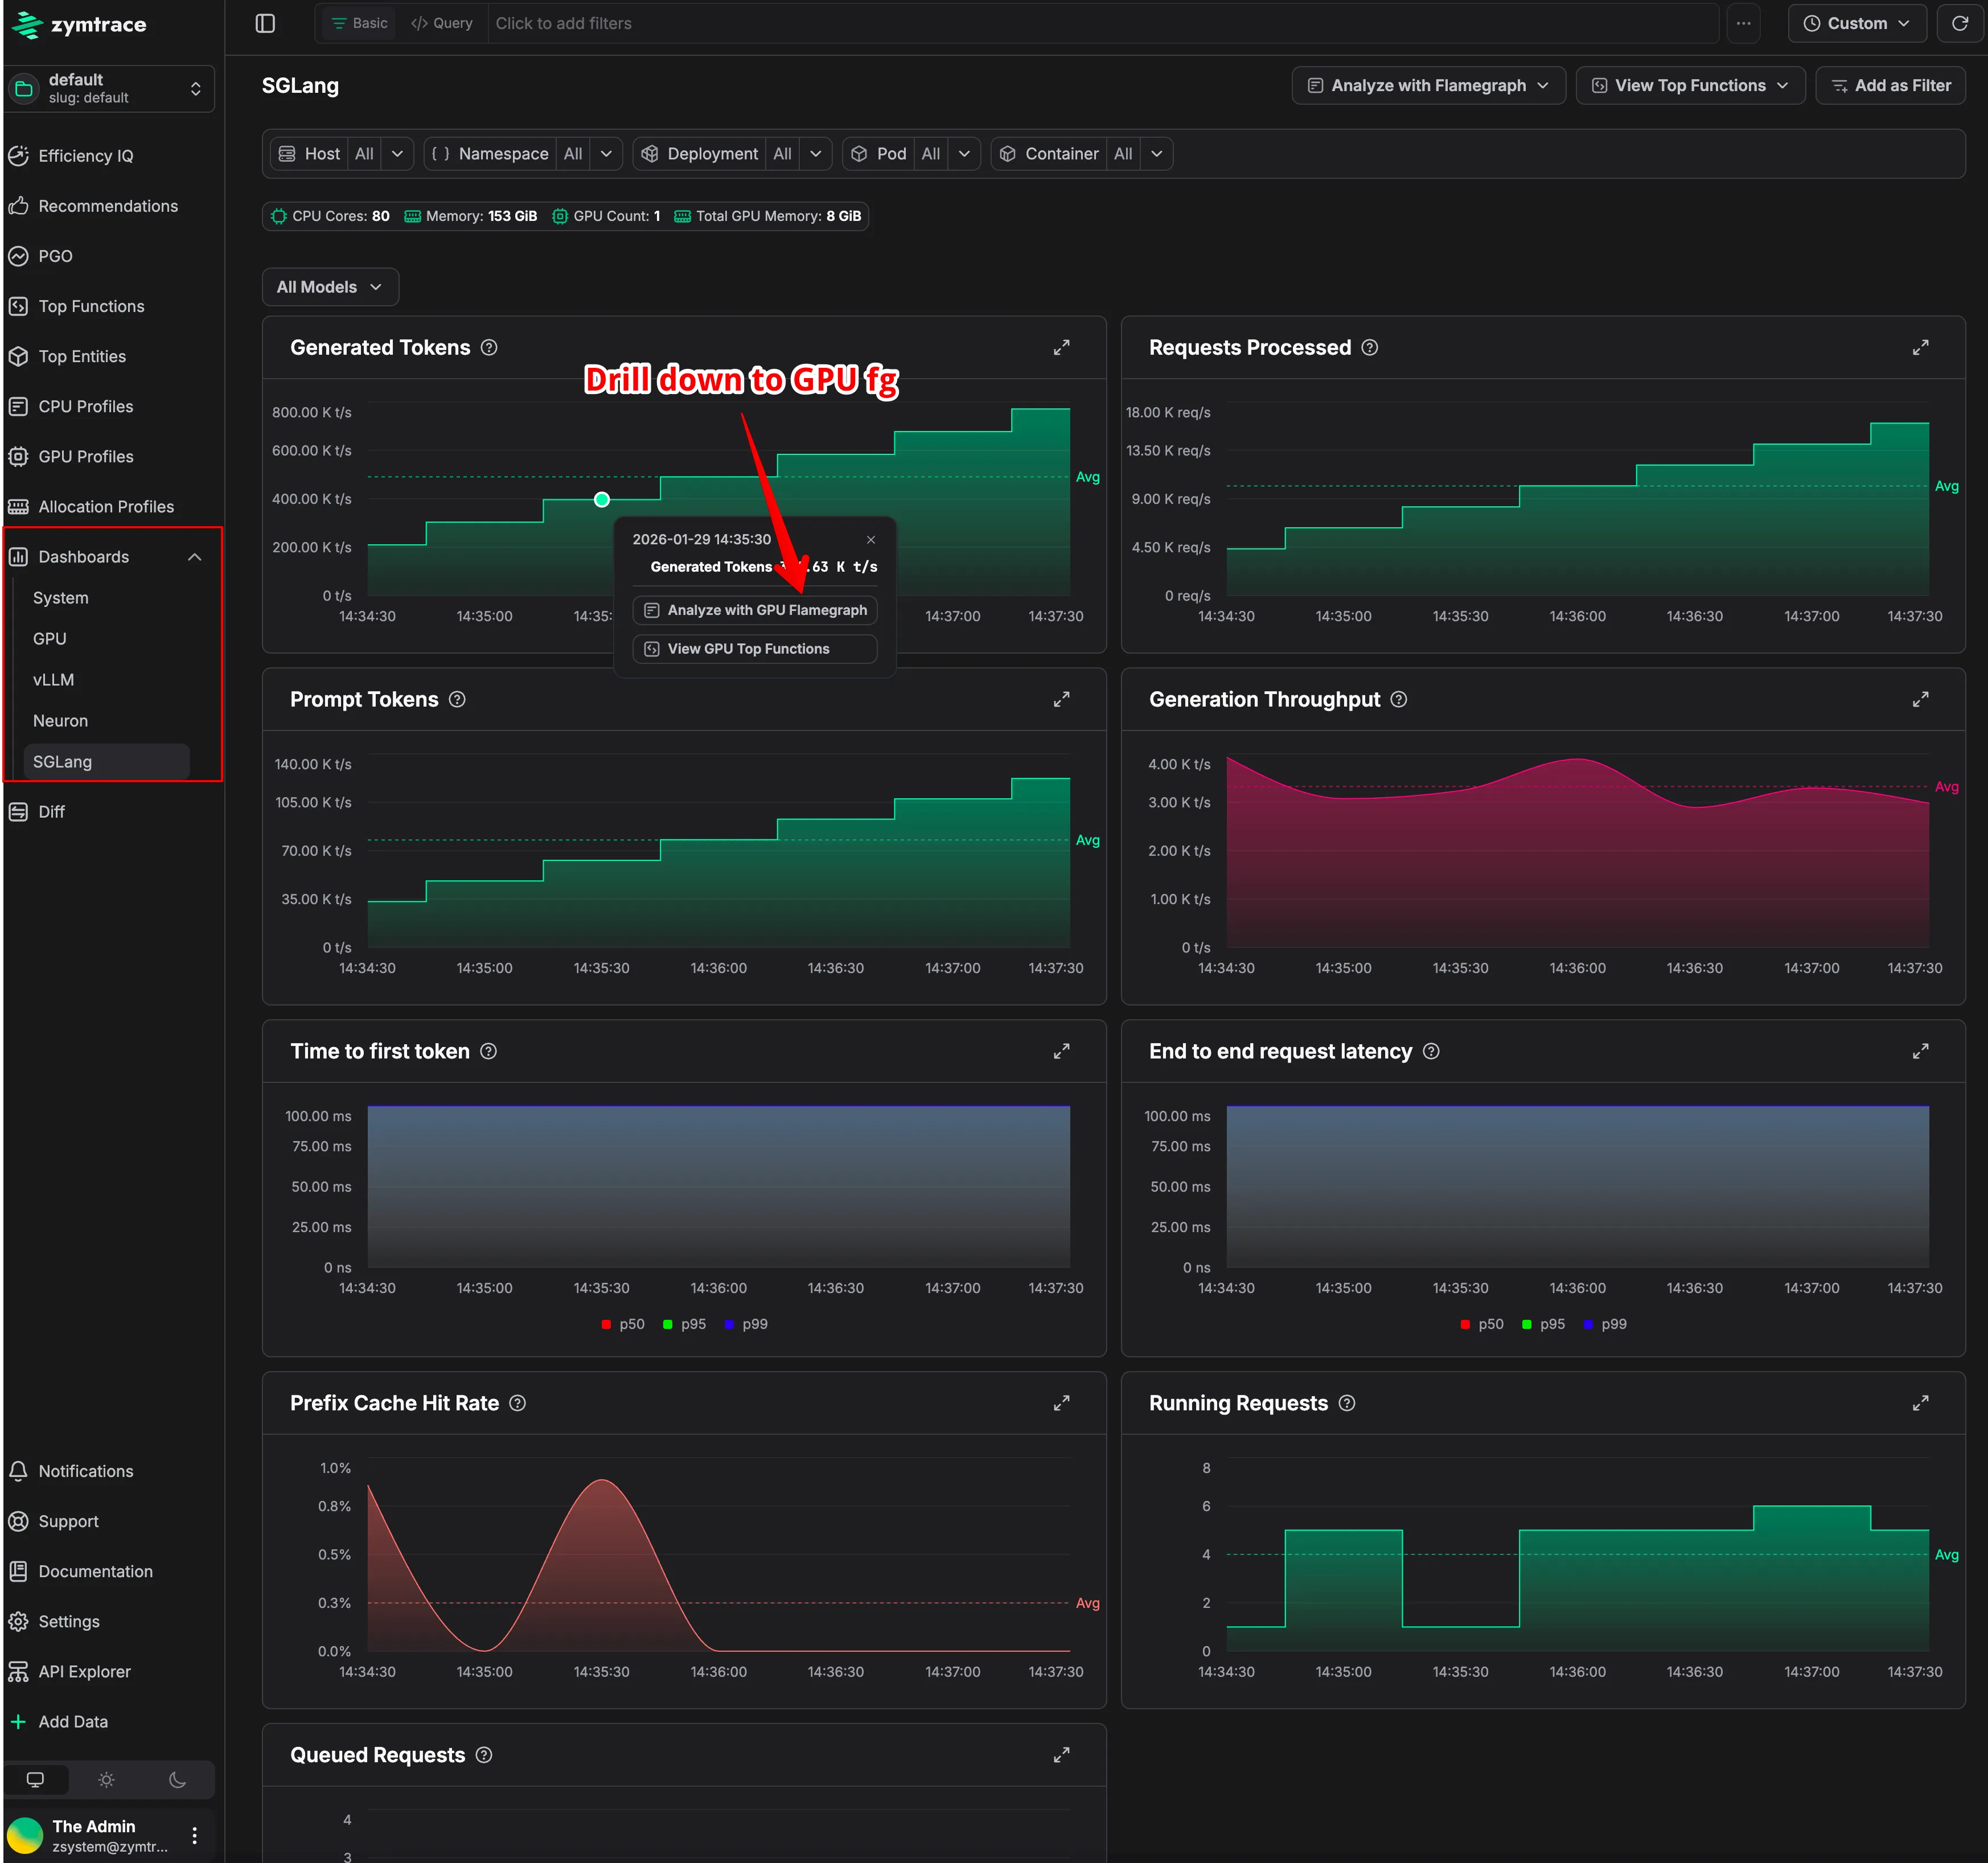
Expanded view of SGLang metrics. Drill down to see why token throughput isn't optimal

See it in action
If you are working on GPU-bound training or inference workloads and want to optimize efficiency and reduce cost, you can easily get started here.


